Friday 30 December 2016

GDX - a very mixed year for the miners

With the precious metals cooling into the yearly close, the related mining stocks were unable to hold early significant gains. The ETF of GDX swung from an opening high of $22.24, settling -4.1% @ $20.86. For December, GDX gained a minor 0.4%. Across the year, GDX gained an extremely powerful 52.5%.


GDX, daily


GDX, monthly


Summary

First, I'd suggest you also go check my year end update for Gold and Silver... which should appear by late Friday night.
--

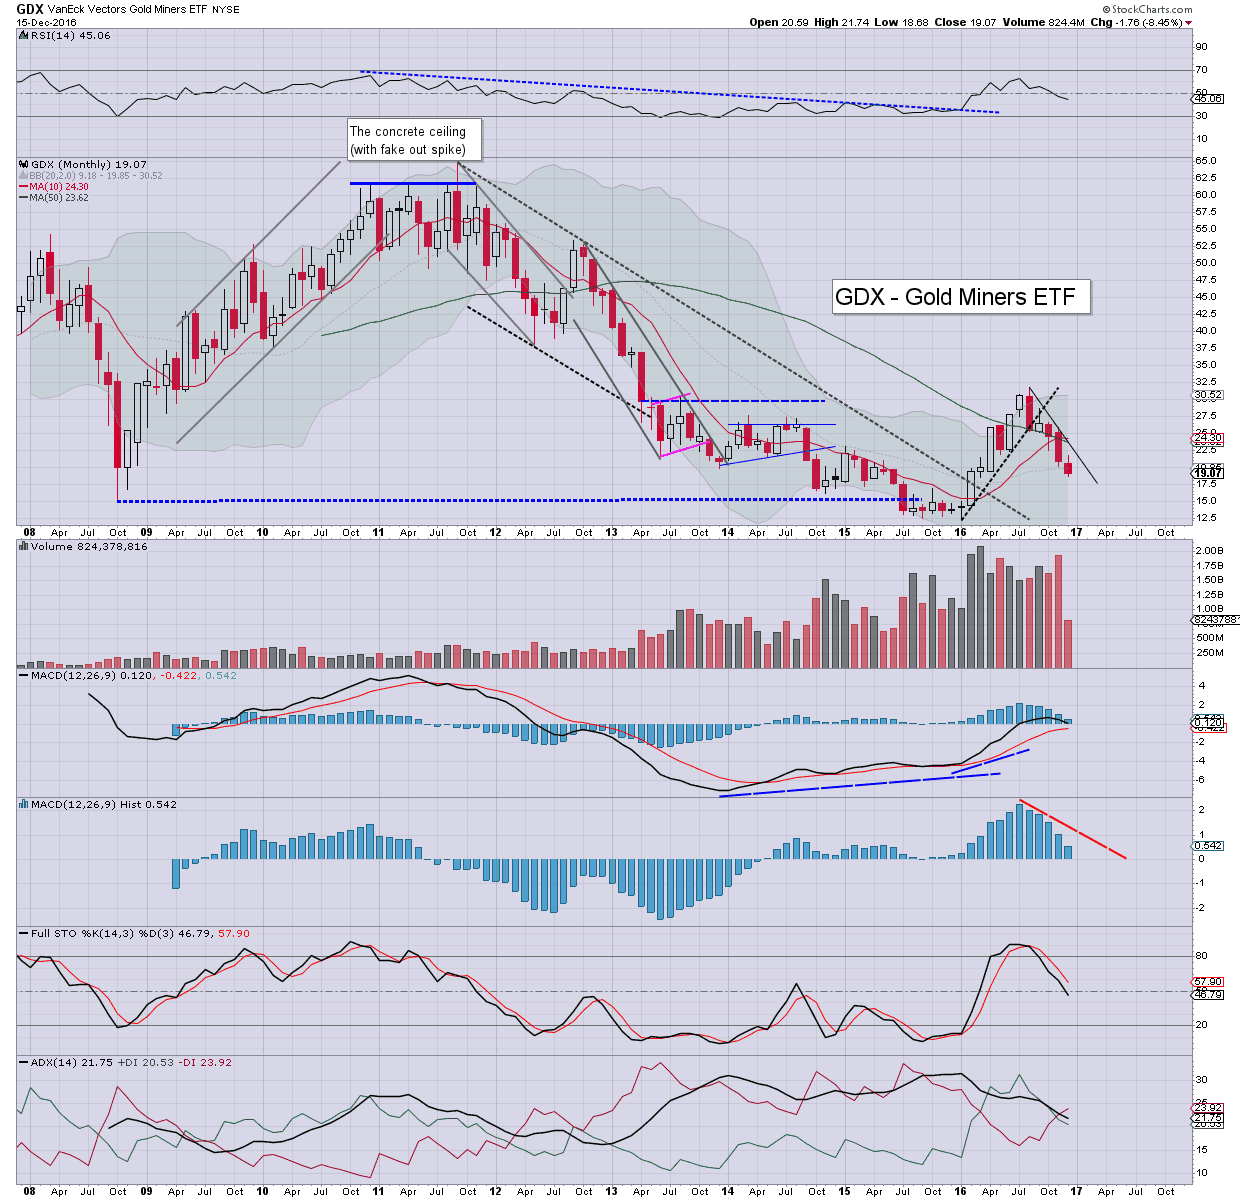
In early trading GDX seemed set for a year end close above the 50dma...but failed. Its not a great sign, and with gold/silver still within mid term downward trends, the short/mid term outlook for the miners remains bearish.

That only provisionally changes with GDX in the $23s.

For full bullish clarity, I want to see a monthly close in the $25s.
--

Its notable that GDX saw a Jan'2016 low of $12.36, hyper-ramping to a peak in Aug' at $31.70, and then cooling by around a third, to settle the year net higher by 52.5%. On any basis... a bullish year, but as noted, there is clearly still a threat of further downside, as Gold and Silver both remain mid term bearish.

Thursday 29 December 2016

GDX - mid term floor already in?

Whilst the main equity market continued to lean weak, there was strength in the precious metals, with Gold +$15, and Silver +0.8%. The ETF of GDX settled powerfully higher for a fourth consecutive day, +7.6% @ $21.77. Near term outlook is bullish, but the mid term trend remains bearish until $25s.


GDX, daily


GDX, monthly


Summary

Its been a very mixed year for the gold/silver mining stocks. GDX swung from a Jan' low of $12.36 to $31.70 in August, only to cool all the way back to the $18s.

The ultimate question... was $18.58 a key higher low?

If yes... some truly wild upside is ahead.

For now..the mid term trend is STILL bearish. That will only provisionally change in Jan' if >$23. For strong bullish clarity, I want to see the $25s.

First big upside target would then be $50. That seems a crazy upside target, but then.. early this year I touted 30/35 by year end. Even I was surprised to see the $30s in the summer.

With one trading day left of the year, GDX is set for a net monthly gain. The price action in Jan/Feb' will be VERY important indeed.

Wednesday 28 December 2016

DIS - a little cooling

With the broader market on the slide, Disney (DIS) was similarly in cooling mode, settling -0.8% @ $104.29. Near term outlook threatens a brief foray to the $101/100 zone. Broadly though, first upside target for earnings (early Feb') is $115. New historic highs (>119.51) look highly probable by late spring 2017.


DIS, daily


DIS, monthly


Summary

Short term.. there is a clear break of rising trend that stretches back to early November.

There is a micro gap zone in the $101s... with the $100 threshold offering natural support. Considering the strength in the broader market, any price action <$100 looks extremely difficult.

Seen on the giant monthly cycle, the MACD (green bar histogram) is set for a bullish cross in late Jan/early Feb'2017, which is suggestive of the $115 where the upper bollinger is.
-

Without question, Disney is in possession of the world's two biggest movie franchises - Star Wars and Marvel. Its ironic that the mainstream have only just started to realise that Disney will be churning out a SW movie at least once a year in perpetuity. Marvel is already averaging two movies a year... with related TV shows on Netflix.

yours... bullish Star Destroyers

GDX - strength in the miners

Whilst the main market held moderate gains across the day, there was more significant strength in the gold/silver miners, with the ETF of GDX settling higher for a second consecutive day, +2.7% @ $19.87. Near term outlook is bullish, but mid term price action remains bearish unless GDX >$25.


GDX, daily


GDX, monthly


Summary

With just three trading days left of the year, its notable that GDX is still set for a third consecutive net monthly decline... and is some 35% (or so) lower from the August high of $31.70.

For now, the mid term trend remains outright bearish.

For the less cautious, first 'conservative' level to start chasing higher would be on a break above the monthly 10MA in the mid $24s.

Personally, I'd like to see GDX $25s before seriously believing a key 'higher low' is in.

Friday 23 December 2016

TVIX, UVXY - holiday decay

It was a week of moderate equity chop, and that saw volatility itself continue to cool. The 2x lev' bullish instruments of TVIX and UVXY both saw net weekly declines of around -11.5%. Near term outlook threatens a little spike in the VIX to the low teens, but that won't do much to inspire TVIX/UVXY.


TVIX,daily


UVXY, daily


Summary

First, an update on the VIX, which saw a net weekly decline of -6.2%.


--
As for TVIX and UVXY, pre-holiday (especially Christmas) trading weeks rarely favour the equity bears/VIX bulls.

Frankly, its not a surprise to see TVIX/UVXY breaking new historic lows this week.

Even if VIX 13/14s before year end, that will do very little to kick TVIX/UVXY that much higher.
--

The VIX-long trade IS dead. That view only changes if we're trading back under the monthly 10MA, which will be around sp'2170/80 in January.

Thursday 22 December 2016

F - bear flag confirmed

Whilst the broader equity market saw some moderate weakness, there was more significant weakness in Ford (F), which settled -1.9% @ $12.40. The bear flag that spanned the past six days has been confirmed, and the break of the 200dma offers a straight run to the 12.20/00 zone.


F, daily


Summary

Suffice to add... today's break lower was kinda expected. Price structure was a rather clear bear flag.. and the fact we broke the 200dma makes the break even more definitive.

Ford should find solid support within the 12.20/00 zone - where the 50dma is lurking.

... and I'll be a buyer there.. for the mid term.

Wednesday 21 December 2016

F - a little cooling

Whilst the broader market traded moderately lower, there was significant weakness in Ford (F), which settled -1.1% @ $12.64. Short term price structure is threatening a bear flag, but that would only be confirmed with a break of the 200dma in the low 12.50s... and that won't be easy.


F, daily


F, monthly


Summary

Suffice to add, Ford looks vulnerable in the short term, but seen on the bigger monthly cycle, an eventual break above declining resistance into the $14s appears due.

Any price action >14 offers a straight run to core multi-year resistance of $16.

Any monthly close >$16 would offer far higher levels, to at least 23/25. That would clearly take a considerable time though... late 2017 at the earliest.

Tuesday 20 December 2016

DIS - the force remains strong in this one

Whilst the broader market closed moderately higher, Disney (DIS) was similarly on the rise (intra high $106.20), but settling +0.1% @ $105.43. Near term outlook threatens a touch of cooling to the 104s, with core support at the psy' level of $100.


DIS, daily


DIS, monthly


Summary

*short term, we've a second consecutive black-fail daily candle. Those are not to be dismissed lightly, and it does threaten brief cooling, but certainly nothing <$100.
--

Disney has naturally received a lot of media attention as a result of the latest Star Wars movie. Rogue One has surpassed most expectations, and is well on the way to being another $1bn dollar movie.

Price structure is mid term bullish. Next soft target are the $110s. Earnings are in early Feb', at which point we could see a spike to the $120s... challenging a new historic high.

Underlying MACD (green bar histogram) is set to turn net positive in Jan', or certainly no later than Feb'. By definition, an acceleration higher is very viable... not least as the broader market remains super strong.

yours... Bullish Star Destroyers.

Monday 19 December 2016

X - short term weakness

Whilst the broader equity market remains very close to historic highs, US Steel (X), remains in cooling mode from the recent high of $39.14, settling today -0.6% @ $34.48. Next soft support is around 32, and then the 30/29 zone. Mid term outlook remains bullish unless Jan' price action <$27.


X, daily


X, monthly


Summary

Suffice to add, X settled lower for the second consecutive day. The break of the $34 threshold is significant (intra low $33.89), and strongly bodes for further weakness to at least the low $32s.. if not 30/29.

Broadly though, like the main market, X looks strong.

Any monthly close >$40 will offer a straight run to the $60s by end 2017.

Friday 16 December 2016

TVIX, UVXY - volatility broadly subdued

As equities continue to regularly break historic highs, the VIX remains broadly subdued. The 2x lev' bullish instruments of TVIX and UVXY saw net weekly declines of -3.0% and -3.1% respectively. Near term outlook offers transitory upside of around 10%... if VIX 14/15s.


TVIX, daily


UVXY, daily


Summary

First, an update on the VIX, which saw a net weekly gain of 3.8%.


--
As for TVIX/UVXY, there is little to add.

Short term... there is threat of relatively moderate upside. Mid term... there is the perpetual decay problem.

--
*yours truly has ZERO interest in being long the VIX in the short/mid term, as the broader equity market is unquestionably super strong.

Thursday 15 December 2016

GDX - miners smashed lower with metals

With the precious metals increasingly weak after the fed raise rates, the related mining stocks were smashed lower for a second consecutive day. The ETF of GDX settled lower by a rather severe -4.1% @ $19.07, the lowest level since early March. Near/mid term outlook is bearish, unless >$25.


GDX, daily


GDX, monthly


Summary

As ever, regardless of broad strength in the main equity market, the gold/silver mining stocks are almost entirely dependent on the price of gold/silver.

Gold and Silver continue their mid term decline from the summer, and are already rather close to the multi-year lows of Dec'2015.

Seen on the giant monthly cycle, we're half way through December, and we're already -8.4%. At the current rate, we'll see a bearish MACD (blue bar histogram) cross in January. For the moment, there is absolutely zero reason to be bullish the metals.. or the related miners.

Wednesday 14 December 2016

RIG, SDRL - drillers cooling with oil

With WTIC oil seeing a net daily decline of around -3.4% in the $50s, many energy stocks were naturally in cooling mode. Transocean (RIG) and Seadrill (SDRL) settled lower by -5.0% and -9.2% respectively. Near term outlook offers further weakness across the next 2-4 days.


RIG, daily


SDRL, daily


Summary

*note the black-fail daily candles as seen on Monday. As ever, those are not to be dismissed lightly, and were good early warnings of the current down wave.
--

Suffice to add... oil is in cooling mode, and along with the broader market retracing, the energy stocks are under particular downward pressure.

Both RIG and SDRL look set for another 5-10% lower in the near term. Broadly though, mid term outlook is bullish, as both have achieved very significant breakouts.

--
Yours truly has eyes on RIG... along with APA, APC, KMI, and MRO.

Tuesday 13 December 2016

X - steel broadly strong

Whilst the broader market closed broadly higher, there was a notable morning reversal in US Steel (X), which swung from a low of $33.78, and settling +0.6% @ $35.00. Near term outlook does threaten some choppy cooling, but broadly, a break above key resistance of $40 looks highly probable in early 2017.


X, daily


X, monthly


Summary

US steel is a company I've not followed in a long time. However, a few traders have highlighted it to me, so I'll be giving it more attention into next year.

Suffice to add, short term bearish, but mid/long term bullish.

--
Sidenote....

Watching the clown finance TV lunchtime show... one of the Najarians highlighted AKS - AK Steel, where someone (or a collective) picked up 5000 of the March $18 calls in the morning. The odd thing is that $18 is almost 80% above the current price.


Does the buyer seriously think AKS could be in the upper teens by mid March?

In any case... the interest in AKS merits some attention.

Monday 12 December 2016

BAC - bearish engulfing candle

Whilst US equity indexes began the week on a somewhat mixed note, there was notable weakness in financials. Bank of America (BAC), broke a fractional new cycle high of $23.26, but then swung significantly lower, settling -2.0% @ $22.63. Near term outlook offers weakness to the mid $21s.


BAC, daily


BAC, monthly


Summary

Suffice to add, today's bearish engulfing candle was a strong indicator that we've seen a short term peak... and headed lower for at least a few days.

This Wednesday the FOMC will raise rates.. as the market expects. Indeed, much of the climb in BAC from the $16s to $23s has been because the market is pricing in a Dec' rate hike.

As noted many times, first big target is the $25/26 zone. Having already seen the $23s, and assuming broader market upside in 2017 of around 20%... the $30 threshold is now a valid target for late 2017/early 2018.

Friday 9 December 2016

TVIX, UVXY - the destruction resumes

With US equities resuming powerfully upward, volatility was crushed back lower, and that resulted in the 2x lev' bullish VIX instruments of TVIX and UVXY net lower for the week by -20.0% and -20.1% respectively. Near term outlook threatens an equity retrace, but broadly, the market remains super strong.


TVIX, daily


UVXY, daily


Summary

First, an update on the VIX, which saw a net weekly decline of -16.8%.


--
As for TVIX and UVXY, last week's gain was entirely negated this week...and then some. There will always be threat of sporadic equity retraces, but broadly... the trend is clear. Equities look super strong into early 2017, and that will keep the VIX broadly pinned low.. probably no higher than the mid teens.
--

As ever, holding leveraged instruments overnight, across the weekend, or multiple weeks, rarely ends well, due to a number of problems, not least 'statistical decay'.

*yours truly has ZERO interest in being long the VIX for the mid term (at least April/May 2017), as the main US market appears headed far higher. That view only changes if sp <2100.

Thursday 8 December 2016

DIS - the force remains strong in Disneyland

With US equities breaking new historic highs, it was another strong day for Disney (DIS), which settled +2.1% @ $103.36, the best level since early May. Near term outlook threatens a cooling/retrace, but broadly, DIS looks set to eventually break new historic highs >$119 in 2017.


DIS, daily


DIS, monthly


Summary

Suffice to say, Disney is broadly bullish.

First target is a year end close somewhere within the 105/107 zone.

Any price action in the 107s will offer a test of the upper monthly bollinger - $115, by earnings in early February. An eventual break above the Aug'2015 high of $119 looks a given, as the broader market is super strong.

--


--

Bullish Rogue one

Wednesday 7 December 2016

F - a long journey ahead

With US equity indexes - notably the transports, breaking new historic highs, it was a particularly bullish day for Ford Motors (F), which settled +4.0% @ $13.06, the best level since late July. Next upside target is the 13.60/80 zone. Any price action in the 14s offers a fast route to multi-decade resistance of the $16s.


F, daily


F, monthly


Summary

A third consecutive day of gains for the best US motor vehicle producer.

We have some sustained trading above the key 200dma, and that does bode for continued upside to the high $13s, certainly no later than mid/late January 2017.

What should be clear, seen on a giant multi-year chart, any move >14 offers the 16s.

Any monthly close in the 16s offers far higher levels. The $20 psy' level will be natural resistance, but frankly, if we do see the 16s, I'll be looking for 23/25. That can understandably be seen as 'crazy talk', but then.. so was BAC 25/26 a few months ago.. and its already in the $22s.

Tuesday 6 December 2016

CHK - rising with Nat gas

It was another bullish day for Chesapeake Energy (CHK), which settled +1.3% @ $7.58. With Nat' gas trading in the $3.60s, the short/mid term outlook for CHK is bullish. Next soft target is a test of the Sept' high of $8.14. Broader upside to the $10/11s seems probable by late spring 2017.


CHK, daily


CHK, monthly


Summary

*first, a brief overview of Nat' gas, on the giant monthly cycle


Like many equities and commodities, Nat' gas floored early in the year, $1.61 in March, and is currently in the $3.60s. The $4 threshold seems a given at some point this winter/early spring. The only issue is whether there is a brief surge to the $5s... but that will surely require a lengthy cold snap for Europe/North America, which is inherently an impossible thing to see ahead of time.
--


Suffice to add, its been a very mixed year for CHK.

Having imploded to a Feb' low of $1.50, the company has battled back, and is now comfortably trending higher.

Things only turn provisionally bearish on any monthly close under the key 10MA, currently in the $5.70s. Considering oil/nat' gas prices, price action under that level seems extremely unlikely.

Monday 5 December 2016

GDX - mixed day for the miners

Whilst the main equity market settled broadly higher, there was some mixed price action in the gold/silver miners. The ETF of GDX saw significant morning weakness of around -2.5% to $20.63, rallied to moderate gains (intra high $21.58), but settled -0.2% @ $21.33. Mid term outlook remains bearish.


GDX, daily


GDX, monthly


Summary

Suffice to add, as ever, the gold/silver miners are almost entirely dependent upon gold/silver prices.

Today saw Gold significantly lower in the morning, but closed above the lows, hence, the miners also rallying.

On the daily cycle, price structure could easily just be another large bear flag - much like the ones we saw in September and October.

Seen on the giant monthly cycle, there is no real sign of a turn/floor. It could be argued price structure is offering a large multi-month bull flag - with a key higher low set to be put in. For now, mid term outlook remains bearish, unless GDX >$25.

Friday 2 December 2016

TVIX, UVXY - short term upside

With equities broadly lower across the week, volatility was on the rise. The 2x lev' VIX instruments of TVIX and UVXY saw net weekly gains of 8.0% and 8.2% respectively. Near term outlook threatens further equity cooling to the sp'2160s, which would equate to VIX 16/17s.


TVIX, daily


UVXY, daily


Summary

First, an update on the VIX, which saw a net weekly gain of 14.4%.


--
As for TVIX/UVXY, short term gains amidst the usual mid/long term horror.

If sp'2160s.. with VIX 16/17s... TVIX/UVXY should see another 10/15% higher

There is little reason that the VIX will be above the key 20 threshold for the remainder of the year.

As ever, the 'statistical decay' is a relentless problem, and holding overnight, across the weekend, or worse... multiple weeks, rarely ends well.
--

*yours truly has ZERO interest in being long volatility, as the broader US equity market remains outright bullish. That view only changes if sp <2130, Dow <18k.

Thursday 1 December 2016

RIG, SDRL - drillers soaring

With WTIC oil powerfully higher for a second consecutive day, there was notable strength in energy stocks. Transocean (RIG) and Seadrill (SDRL) settled higher by a very significant 3.6% and 11.1% respectively. Near/mid term outlook is now bullish, with a clear 25/30% upside by mid 2017.


RIG, daily


SDRL, daily


Summary

RIG is leading the way... well above key resistance of $13. There is little but empty air to the $18/20 zone. Current price action is threatening an insane ramp to that level within weeks... rather than months. Regardless... it is a bullish break.

SDRL has followed RIG, with a massive break above declining trend/resistance, which is where the 200dma is also lurking. Its a massively bullish break. Next upside is the soft psy' level of $4, and then the April 29th high of $5.21.

Both certainly merit attention into year end. 

Wednesday 30 November 2016

GDX - a dire November for the miners

With the precious metals of Gold and Silver seeing rather severe net monthly declines, the related mining stocks were naturally dragged massively lower. The ETF of GDX settled the day -1.9% @ $20.83, which made for a net monthly decline of -15.1%. Near/mid term outlook remains outright bearish.


GDX, daily


GDX, monthly


Summary

Its pretty straight forward...

Higher USD - as interest rate expectations are really starting to ramp.
The higher USD is putting natural downward pressure on the precious metals.

With economic/market sentiment at the best levels since 2007, the precious metals are losing more of their inherent 'fear bid'.

With the precious metals lower, the Gold/Silver miners have duly repriced to the downside. The only issue now is whether GDX puts in a higher low, or breaks below the Jan'2016 low of $12.40.


The one indirectly bullish aspect for Gold/Silver is Copper

Copper, with Gold/Silver, monthly, 20yr.


Its difficult to see Copper continue to climb across much of 2017, without Gold/Silver not eventually catching up.